
Using Cucumber to do Behaviour driven development (BDD) is great but sometimes a single bug can have impacts on several tests. This article tries to address this.
After introducing Cucumber support to our test tool we realized that there was something missing in the standard Cucumber report view.
Check the following example

Looks bad, eh? It’s hard to say. We can see that the business impact is vast, as we have many features breaking. Let’s say we have a problem with the login, and a single issue is breaking all the tests? We have no idea how many underlying bugs are causing these failures. A single problem or a myriad of issues?
Moreover, it would be interesting to classify if issues are due to known problems in the application or automation code. As a single tester, this is not so necessary, but as a team, it’s crucial that if someone has already analyzed an issue, it is highlighted as a “known issue.”
As we typically are running several parallel test workers, we also found it complex troubleshooting tests, as we did not know which worker that ran which scenario.
To summarize, we needed the following information.
To solve this, we added we added additional data to the Cucumber report JSON. We also updated our tool with a view where users can map the error hash (a simple MD5 sum of the error message) to their own bug system and also categorize the issue in one of the following categories
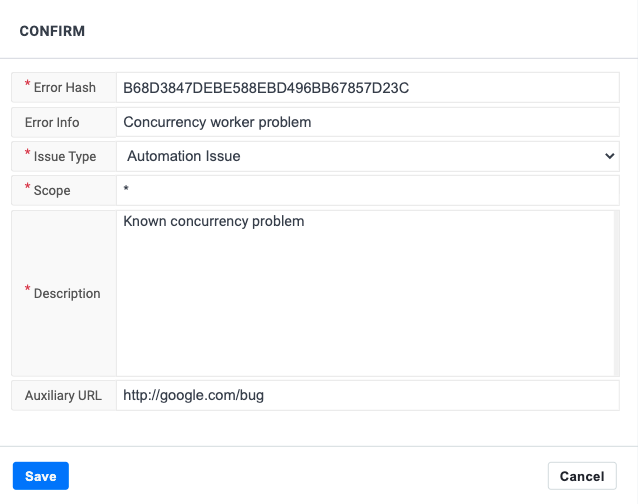
If you are working in any other tool or using Open Source Cucumber, you can easily add this lookup in a JSON or flat file on your system.
We added the additional fields directly in the Cucumber report JSON inside the scenario tag like this
   "extraData": {
          "id": "m119.t1(1)",
          "name": "Minimum items",
          "worker": "Mats Ljunggren - 3",
          "start": "22:15:24",
          "end": "22:16:13",
          "failed": "5e3f275e64f84941a326d4d8/ci50/m10/t29/5/",
          "rootCase": {
            "createStamp": {
              "user": "592ed7aefcaff23cca3a703d",
              "time": 1612540246197,
              "ip": "1"
            },
            "updateStamp": {
              "user": "592ed7aefcaff23cca3a703d",
              "time": 1612540246197,
              "ip": "1"
            },
            "_id": "601d695609eb4153f44a79e8",
            "type": "auto",
            "scope": "*",
            "errHash": "B68D3847DEBE588EBD496BB67857D23C",
            "errDesc": "Concurrency worker problem",
            "desc": "Known concurrency problem",
            "url": "http://mybugtracker.com/bug",
            "projectId": "5e3f275e64f84941a326d4d8",
            "__v": 0
          }
        }
You can find a sample log here
https://github.com/ljunggren/bz-utils/blob/main/scripts/test/report_cucumber-m88-t1.json
Disclaimer: This might not be according to Cucumber report specifications, but we do find it a very useful hack to compliment the Cucumber logs.
We then created a script to gather this into a custom report that can be added to your CI pipeline.
https://github.com/ljunggren/bz-utils/blob/main/scripts/generate_summary.sh
It’s written in bash so it should be easily run on any system, but it does require the jq json parser to run.
To show the report in Jenkins, we use the HTML publisher plugin using the following configuration.
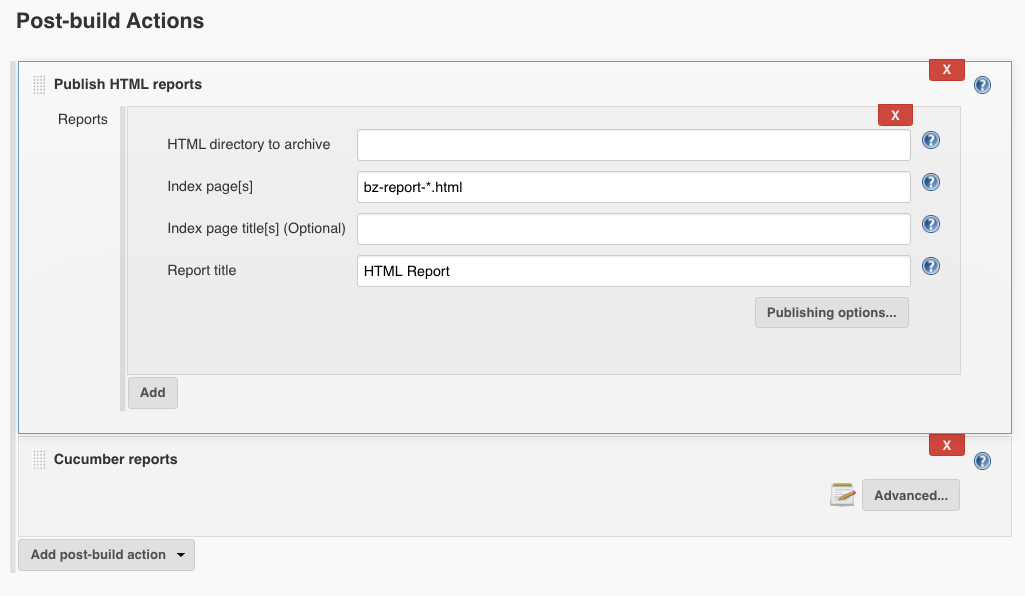
To allow for the CSS rendering, we needed to do the following update to our Jenkins setup.
sandbox; default-src 'none'; img-src 'self'; style-src 'self';In the end we added the following step to our Jenkins pipeline.
This is the final result

The new report allows us to:
Let us know if this is helpful in any way.
Codeless testing that works. No credit card or commitment required.