Graphic test maps
Quote from ljunggren on May 24, 2020, 8:26 pm
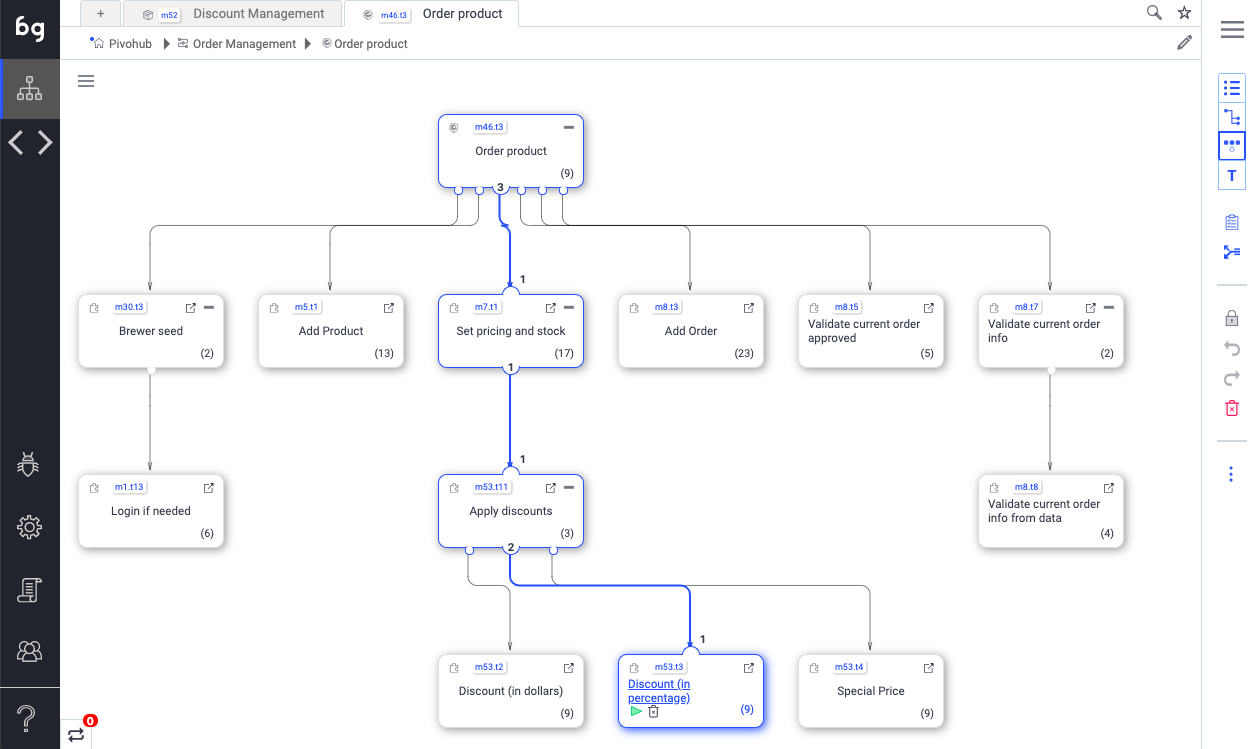
We are very proud to introduce a much-requested feature: graphic test maps. Simply switch to the graphical view using the view selector on the right-top bar. This can be used in three different ways currently
- Module level: Show all test relationships in module
- Project-level: Show all test relationships in project
- Search: Show all tests for a certain searched tag or keyword (very powerful)
This mode can be used in a variety of ways.
- Effective knowledge-transfer (when on-boarding new team member)
- Documenting tests
- Trouble-shooting
- Audits
- Optimizing / Improving test re-use
The map is fully selectable, meaning you can select and test on any level to show test relationships (both cascading up and down). If the map has too much information, you can also remove certain tests to the "legend", to simplify the view.
Let us know what you think!
Quote from Gianni on May 25, 2020, 3:58 pmExcellent work! This is a very important feature when you manage large projects and have to keep it well organized. And extremely useful for onboarding new comers.
Excellent work! This is a very important feature when you manage large projects and have to keep it well organized. And extremely useful for onboarding new comers.
Quote from ljunggren on May 28, 2020, 12:29 amGreat to hear. We have done a of improvements to this too. Coming up in the next release (this week-end).
Great to hear. We have done a of improvements to this too. Coming up in the next release (this week-end).
Quote from ljunggren on June 8, 2020, 12:21 amWe just added the information that was suggested to us in tonight's release. When a test is selected, you can see upstream and downstream tests, including data. Let us know if this makes sense.
We just added the information that was suggested to us in tonight's release. When a test is selected, you can see upstream and downstream tests, including data. Let us know if this makes sense.